- American Economy Daily
- Posts
- What CPI Report? Rate Cuts Takeover.
What CPI Report? Rate Cuts Takeover.
History says rate cuts are not a good sign.
Auto Insurance: Overpriced!
Just because you have to renew your auto insurance every 6 months does not mean you have to overpay!
The sad truth: 50% of U.S. drivers overpay for their auto insurance.
There are 3 SIMPLE steps to solve the problem:
Step 1) Visit our page on this
Step 2) Enter your Zip Code, fill out a 1-page form
You will really enjoy the benefits of this simple process; you no longer have to be in the 50% that overpays!
BLS Inflation Report Breakdown
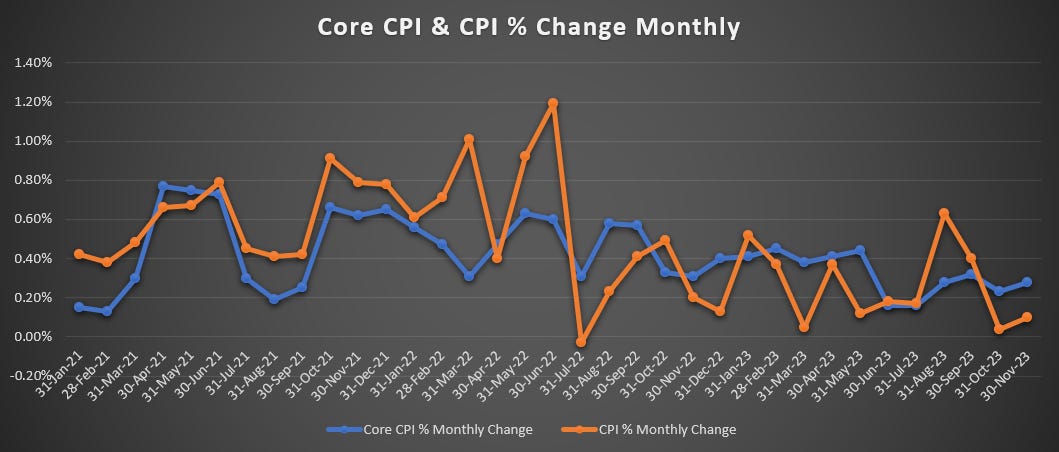
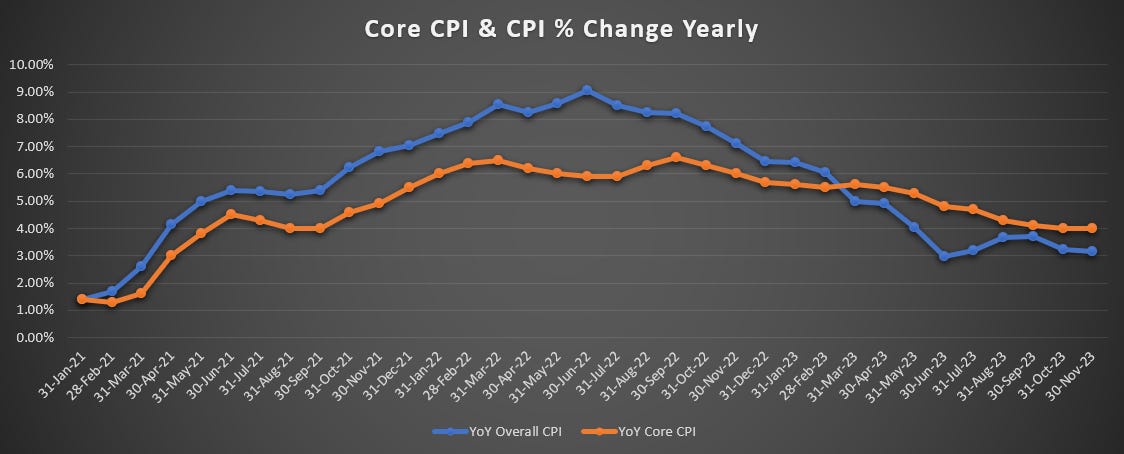
From October to November, Core CPI increased by 0.28% the largest increase since June. This rise was driven by housing, healthcare, and insurance costs, which account for approximately 65% of consumer spending. However, the overall CPI increased by just .1%. This was mainly due to a 6% month-to-month plunge in gasoline prices and a drop in durable goods prices, which offset the 2.5% increase in core services. The year-over-year overall CPI stands at 3.1% and the year-over-year Core CPI stayed unchanged at 4%.
Month-Over-Month Overall CPI & Core CPI

Year-Over-Year Overall CPI & Core CPI

Looking at the CPI chart, it is clear that all items less food and energy, Core CPI have remained relatively flat compared to last month at 4%. However, shelter prices, which make up about 1/3 of the CPI weighting, increased 0.5% on the month and were up 6.5% year-over-year. This does not necessarily mean that housing itself is up, but rather reflects a subjective metric based on what people would rent their house for. The Zillow Observed Rent Index (ZORI), which tracks asking rents of vacant units on the market, also showed an increase of 0.23% to $1,982.
In terms of consumer spending, food prices rose to new record levels from already high levels. The food CPI increased by 2.9% year-over-year, on top of a 24% spike during the pandemic. Energy prices, on the other hand, dropped by 2.3% month-to-month, driven by a 6% month-to-month drop in gasoline prices.
The durable goods CPI, which includes new and used vehicles, information technology products, appliances, furniture, etc., declined by 0.6% year-over-year. This decline is attributed to the easing of pandemic-era shortages, supply bottlenecks, and transportation chaos that had previously caused a historic price spike.
CPI Outlook
The prevailing economic conditions suggest that the Consumer Price Index (CPI) is likely to remain stable unless influenced by a significant catalyst.
On the deflationary side, this catalyst could be a recession or hard landing, as predicted by the inversion of the yield curve. When numbers soften dramatically, it usually indicates that we are either in or headed into a recession. This typically prompts the Federal Reserve to lower rates to address a potential crisis.
Despite any stimulus packages or fiscal or monetary policies implemented by central planners, significant disinflation is usually observed during these periods. This was evident in 2020 and we saw outright deflation in 2009. The base case scenario is that we will have a hard landing, leading to continued disinflation or deflation. However, this is unlikely to be significant until we see an increase in the unemployment rate and other indicators of a global financial crisis.
On the inflationary side, the catalyst that could drive inflation higher could be a repeat of the events of 2020. The government could potentially implement another shutdown or lockdown, which is not an impossibility. Other potential triggers could be geopolitical events such as escalating tensions in the Middle East or between Russia, Ukraine, and NATO.
Any event that disrupts supply chains to the same degree as they were disrupted during the pandemic could lead to increased prices. The government's response to such an event would likely be another massive fiscal stimulus package. If we start to see disinflation under 2% and then experience a quarter of deflation like we did in 2009, they are likely to revert to their previous game plan. This, combined with supply chain disruption, could lead to a temporary increase in prices.
Mainstream is Pushing Rate Cuts
Interest rate cuts has been the mainstream major topic of discussion as opposed to the actual CPI report. The narrative suggests that now that inflation is coming back down and the economy is still doing well, the Fed can start to drop rates. Its important to note the last mile is the hardest in terms of bringing inflation down to the Fed’s target of 2%. The Fed is trying to balance the risk of moving too slowly to ease policy, which could lead the economy to slump under the weight of its past increases, against the risk of easing prematurely and seeing inflation settle above 3%—well above their 2% target.
Central banks have historically cut rates to stimulate a deteriorating economy and job market. The Fed Funds Rate has also historically taken the stairs up and the elevator down. This goes against the narrative that rate cuts will be done in a controlled manner. When rate cuts have occurred it is generally in response to a crisis.

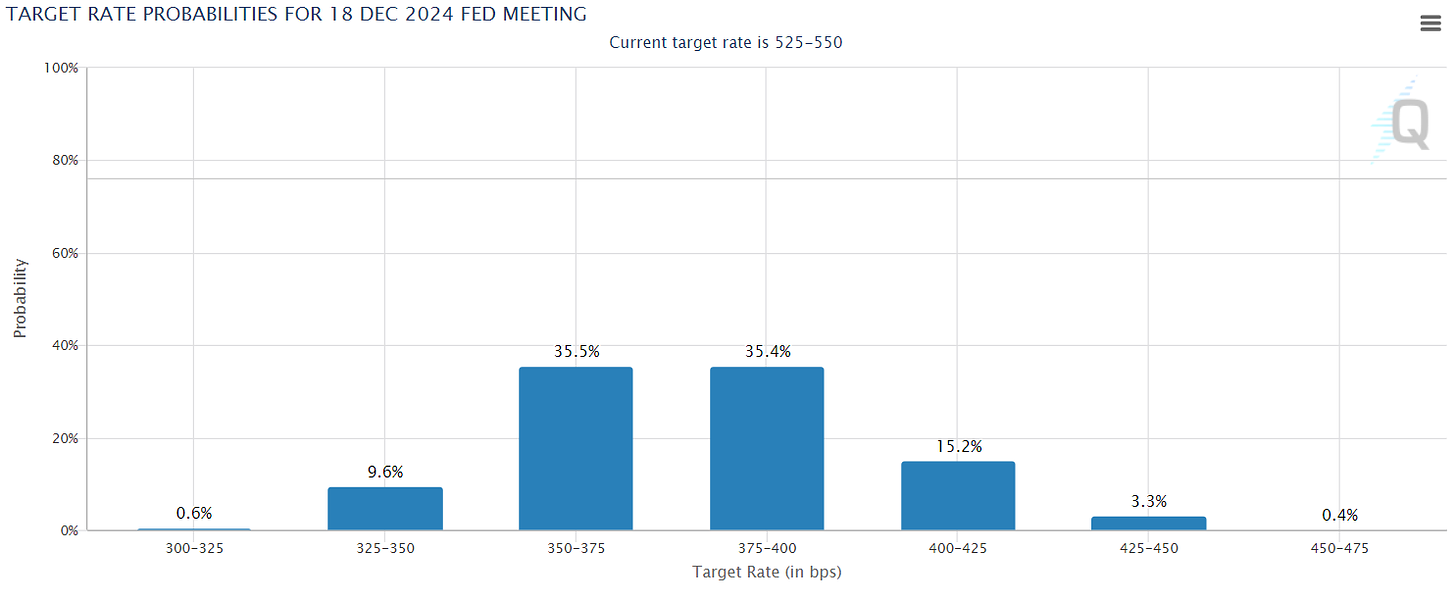
The Federal Reserve is expected to lead the way among advanced economies toward lowering interest rates in the coming months. As of now, investors are pricing in a more than 98% chance of no rate increase and interest-rate futures markets anticipate the Fed will cut rates by about 108 basis points in 2024, implying four cuts of a quarter-point. This is more aggressive than what interest-rate futures are currently pricing in. The European Central Bank is expected to lower rates in June, with Bank of England policymakers following in the second half of the year.

Thanks For Reading!
If you want to advertise your business to the 200,000+ readers of this newsletter, learn more here.
Thanks for reading American Economy Daily! Subscribe now to receive new posts and support our work.