- American Economy Daily
- Posts
- Jobs and Juxtapositions
Jobs and Juxtapositions
Americans Gaslighted by Assertions of a Thriving Economy
Sponsored by

Your SOC 2 Compliance Checklist from Vanta
Are you building a business? Achieving SOC 2 compliance can help you win bigger deals, enter new markets and deepen trust with your customers — but it can also cost you real time and money.
Vanta automates up to 90% of the work for SOC 2 (along with other in-demand frameworks), getting you audit-ready in weeks instead of months. Save up to 400 hours and 85% of associated costs.
Download the free checklist to learn more about the SOC 2 compliance process and the road ahead.
Help us keep going! Support our sponsors – they're the key to our publication's future. Please click the above to do so. Free to you and helps us greatly.
Jobs Reports Overview
According to the BLS Jobs Report the U.S. added 199,000 jobs in November. These job additions were driven largely by the conclusion of major national strikes. The unemployment rate edged down to 3.7% in November, and the number of unemployed persons decreased from 6.5 million to 6.3 million. Jobs growth in September continues to be revised downward from the initially report 336,000 to now 262,000 (75,000 jobs revised down). In fact, every report this year has been revised down after the fact except for one. The pace of wage growth remained fairly resilient in November, with wages increasing by 4% in the last 12 months. The consensus of the jobs report seems to be that the report was not strong enough to scare the Federal Reserve into hiking rates, but not weak enough to raise recession worries.
Of the 199,000 jobs the BLS claims the economy created, about 24% were auto workers and motion picture workers returning to their jobs after strikes. Of the rest of the jobs, 82% were in the healthcare and government sectors. The manufacturing sector reported a 28,000 job gain, but this was largely due to 30,000 auto workers returning to work. In other words, the economy actually shed 2,000 manufacturing jobs.
The ADP private payroll came out last week and the data came out worse than expected. The estimate for the ADP report was 123,000 new private sector jobs, but the actual number came in at 103,000. Within that number, the economy lost 15,000 manufacturing jobs. The ADP report also showed a drop in leisure and hospitality jobs, a sector that has been driving recent job growth. The BLS reported an additional 40,000 jobs in leisure and hospitality which is contrast to the ADP report.
Seasonal hiring has been moderate this year, suggesting that retailers are expecting muted holiday sales. Retail employment fell by nearly 40,000 jobs in November as the industry braced for a potentially challenging holiday season. Department stores lost the most jobs, followed by furniture, electronics, and appliance retailers. This slowdown in hiring may be due to consumers doing more of their holiday shopping online, leading retailers to scale back on hiring in-store personnel. Despite this, employment in transportation and logistics also fell, indicating an unusual trend in the labor market.
The average workweek increased slightly to 34.1 hours from October. While this slight uptick represents a decline from the high of 35 hours hit in January 2021, it is typically seen as an indicator of business growth.
Disconnect Between Academia & Everyday Americans
Although the unemployment rate has remained impressively low, hovering below 4% for several years, there is an underlying, more troubling trend that merits attention: an increasing number of individuals are living on the brink of financial stability. Despite some economists heralding the strength of our economy and asserting that people are better off now than they were pre-pandemic, this perspective often overlooks the daily realities faced by many Americans. This narrative dismisses these economic concerns as mere negative attitudes & fails to acknowledge the growing financial insecurity that belies the optimistic economic indicators. There exists a significant disconnect between the interpretations of economic data by some experts and the actual experiences of everyday Americans.
Let's examine the financial stability of Americans through a series of charts.
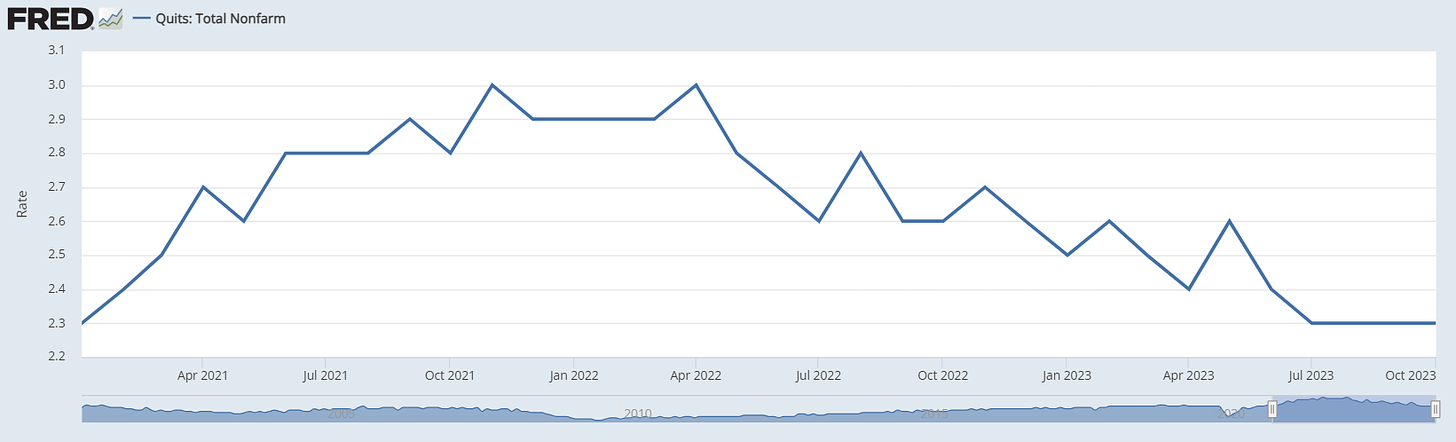
Quits Rate
The U.S. job market has transitioned from the Great Reshuffle, characterized by mass employee resignations, to a phase marked by reduced rates of quits, hires, and layoffs. This shift suggests a potential for slower wage growth. The decrease in quits also indicates a preference among employees to stay in their current roles, possibly as a precaution against an impending economic recession. With macroeconomic conditions appearing less favorable, and considering the common 'last-in, first-out' approach to layoffs, workers are more inclined to hold onto their existing positions.
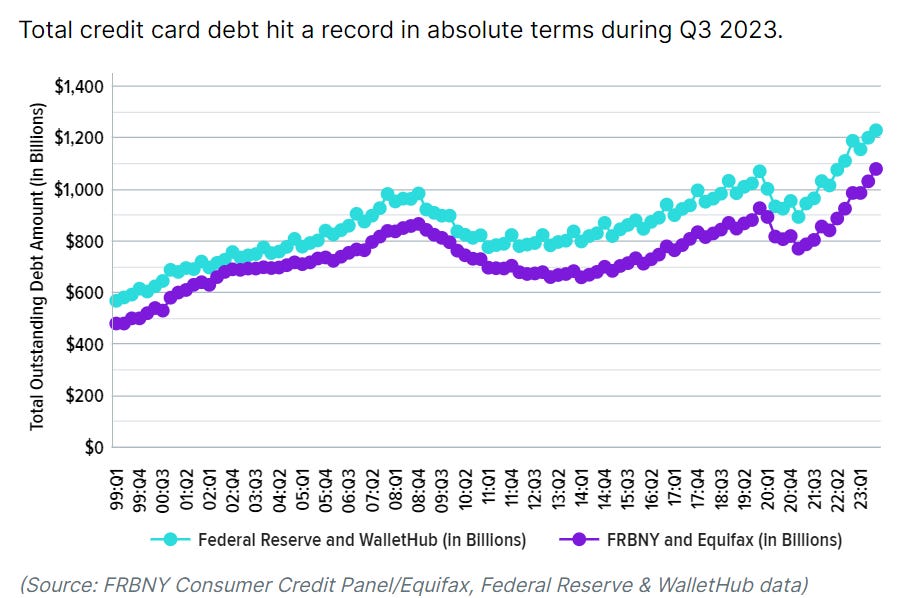
Credit Card Debt
source.
In recent years, there has been a significant surge in credit card debt, reflecting a worrying financial trend. As consumers' savings dwindle, many are increasingly turning to credit to maintain their standard of living. This shift towards higher reliance on debt suggests that for a growing number of individuals, personal savings are no longer sufficient to cover daily expenses and lifestyle costs. Consequently, credit cards are not just a convenience but a necessity, bridging the gap between income and expenditure.
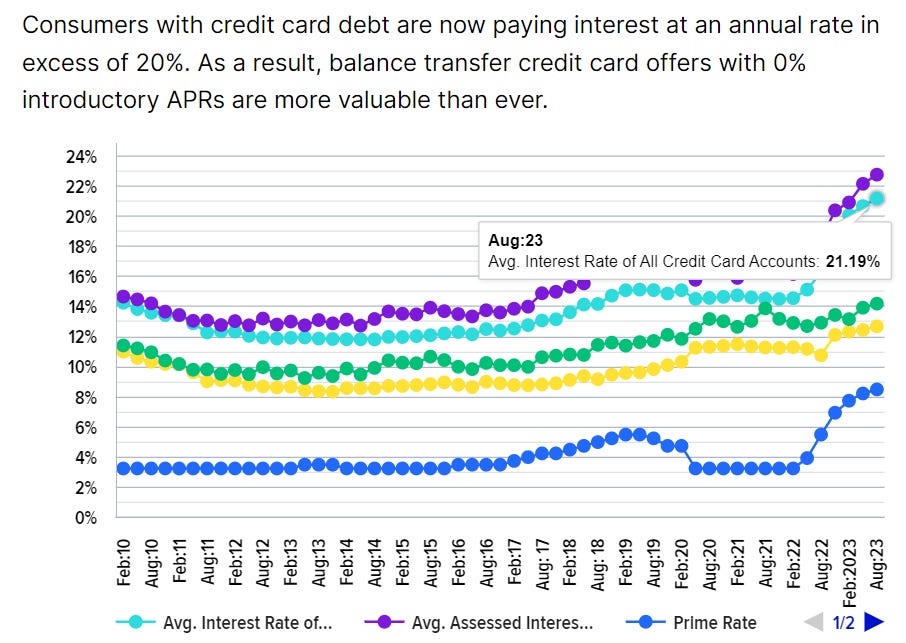
Credit Card Interest Rates
In addition, credit card interest rates are skyrocketing, with consumers facing an average rate of around 21%. This high interest rate suggests that many consumers are compelled to use credit cards for necessary purchases, indicating a reliance on debt for essential spending.
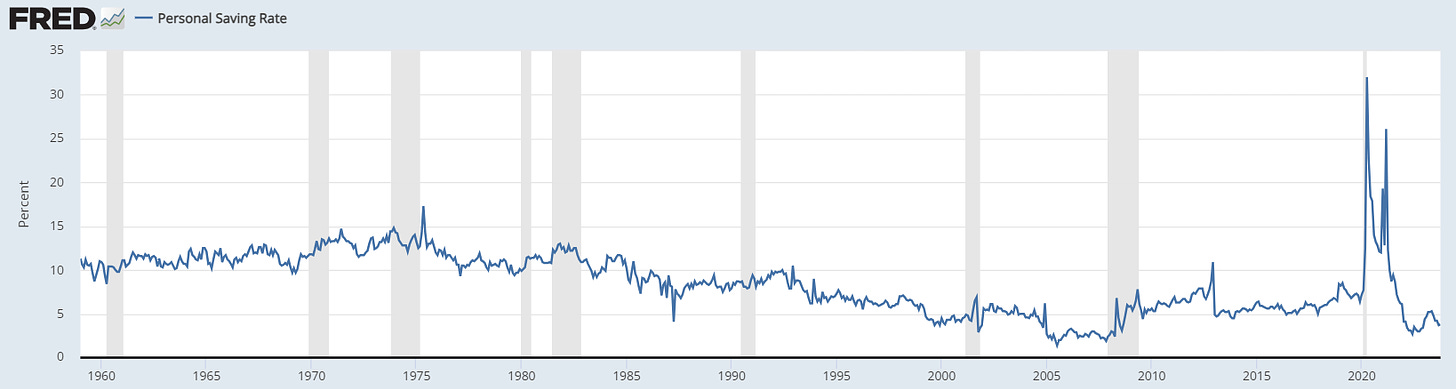
Personal Savings Rate
(personal income / personal savings)
Examining the historical trajectory of the personal savings rate in the United States reveals a stark decline. Between 1960 and 1975, Americans typically saved between 10% to 15% of their income, but this rate has plummeted to a mere 3.8% in recent times. This significant decrease is noteworthy, especially considering that it follows a period of artificially inflated savings rates, which soared to 30% due to stimulus injections. While there are numerous factors contributing to this rapid decline, the critical takeaway is the consistent, decades-long reduction in the proportion of income that Americans are saving.
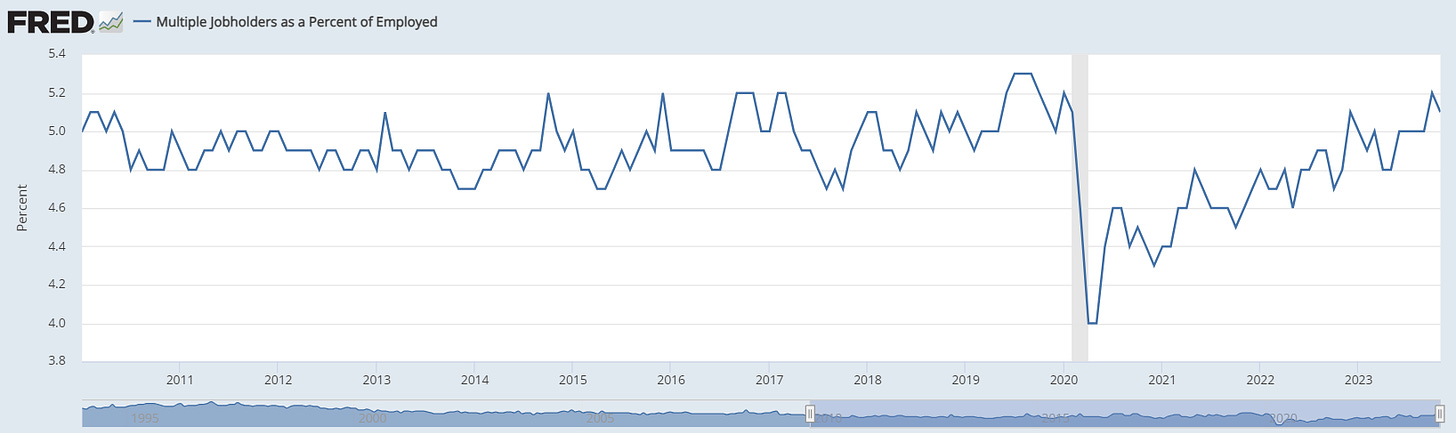
% Of Jobholders With Multiple Jobs
Since 2021, the proportion of jobholders working multiple jobs has increased from approximately 4.5% to a peak of 5.2%. Yet, when viewed in the context of the past 20 years, this range – fluctuating between 4.8% and 5.2% – appears relatively normal. Historical data from the Bureau of Labor Statistics even shows similar patterns extending back to the 1970s and 1980s, here, indicating that this trend is not a recent phenomenon.
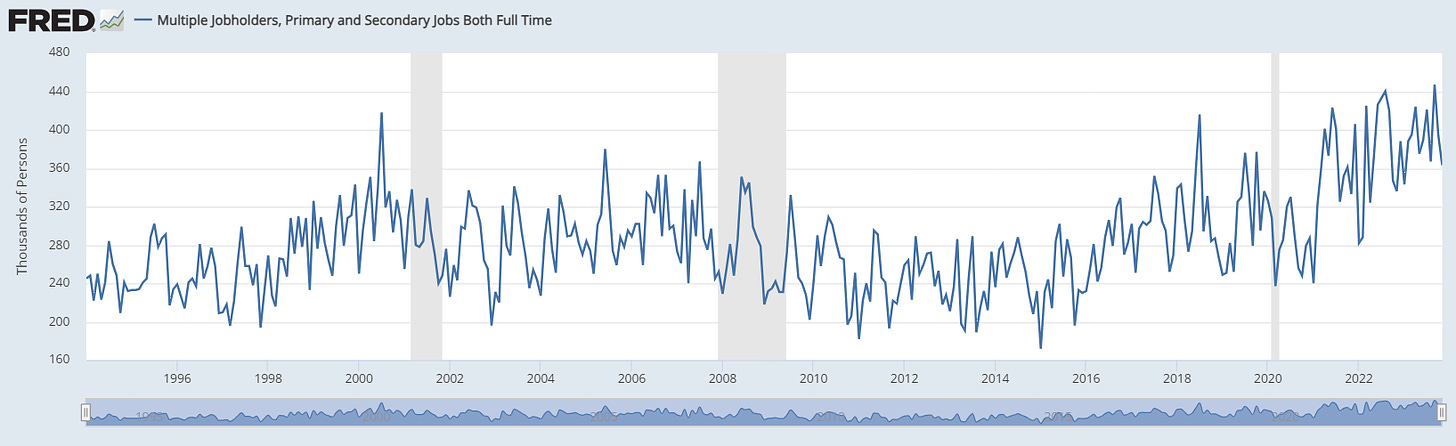
Multiple Jobholders where both jobs are full time.
When we shift our focus to those holding multiple full-time jobs, the narrative changes. This trend aligns more closely with how Americans have perceived the economy in recent years. Data from the 2020s shows a noticeable uptick in the range of individuals juggling two full-time positions, a shift that stands in contrast to the relatively stable figures observed over the previous two decades.
Wrap Up
While traditional metrics like the low unemployment rate suggest a strong economy, deeper analysis reveals increasing financial pressures on individuals, such as rising credit card debt and a declining personal savings rate. The trend of workers holding multiple jobs, especially multiple full-time positions, further underscores the challenges many Americans face in achieving financial stability. These insights highlight the importance of looking beyond surface-level economic data to understand the real experiences of everyday Americans, experiences that often tell a more nuanced and less rosy story of economic hardship and resilience.